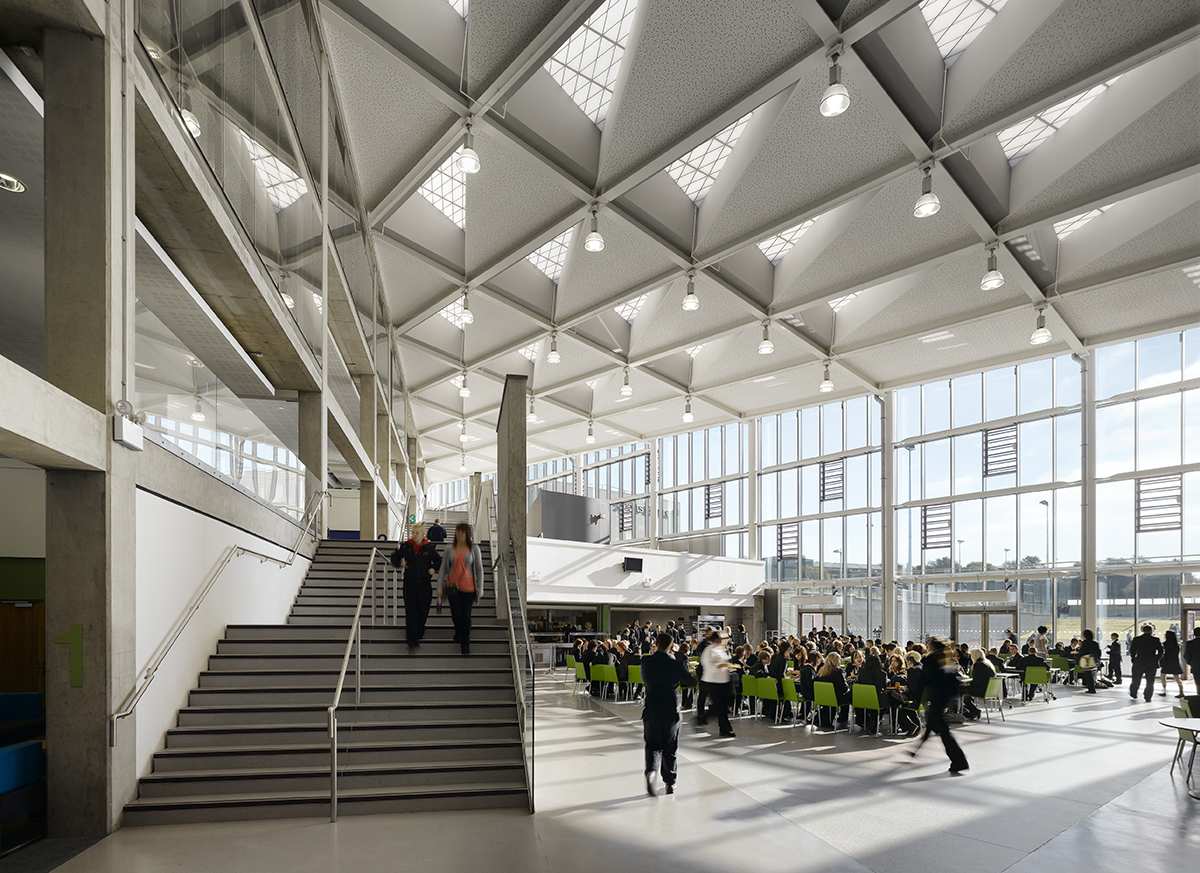
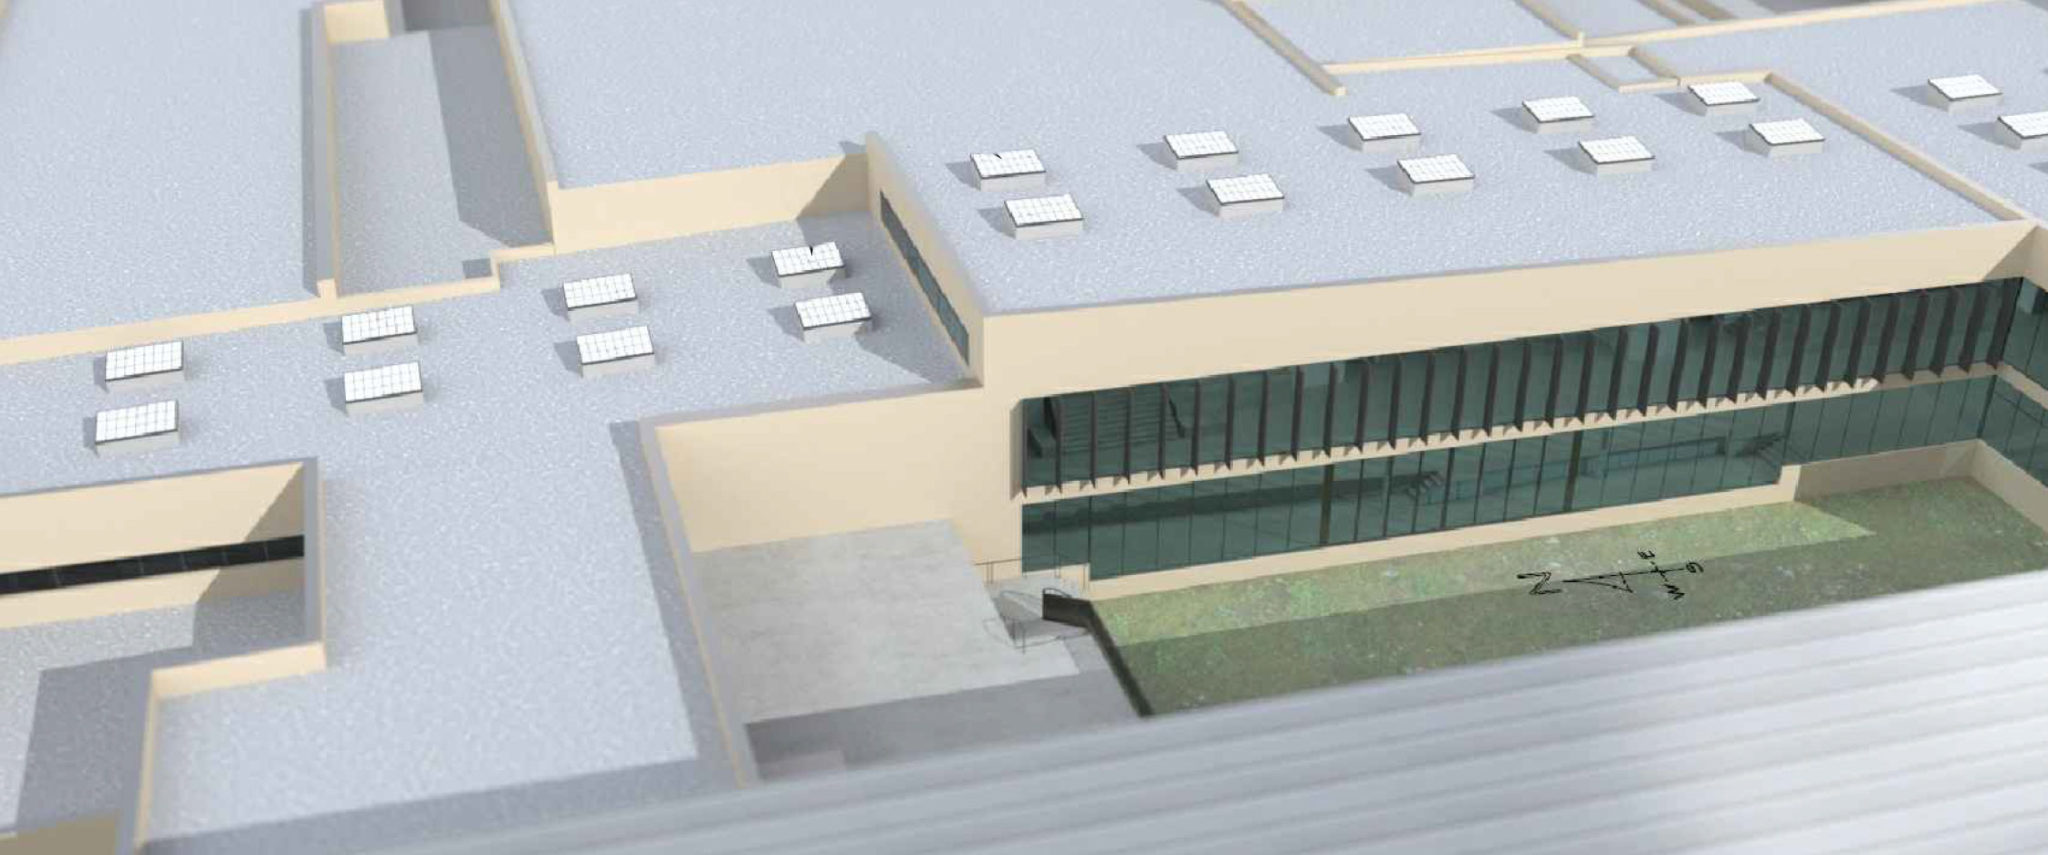
The metrics described on this page are from an example model for a high school common space in the Pacific Northwest.
We use international weather files that most closely match a project’s location to generate results.
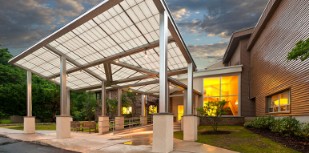
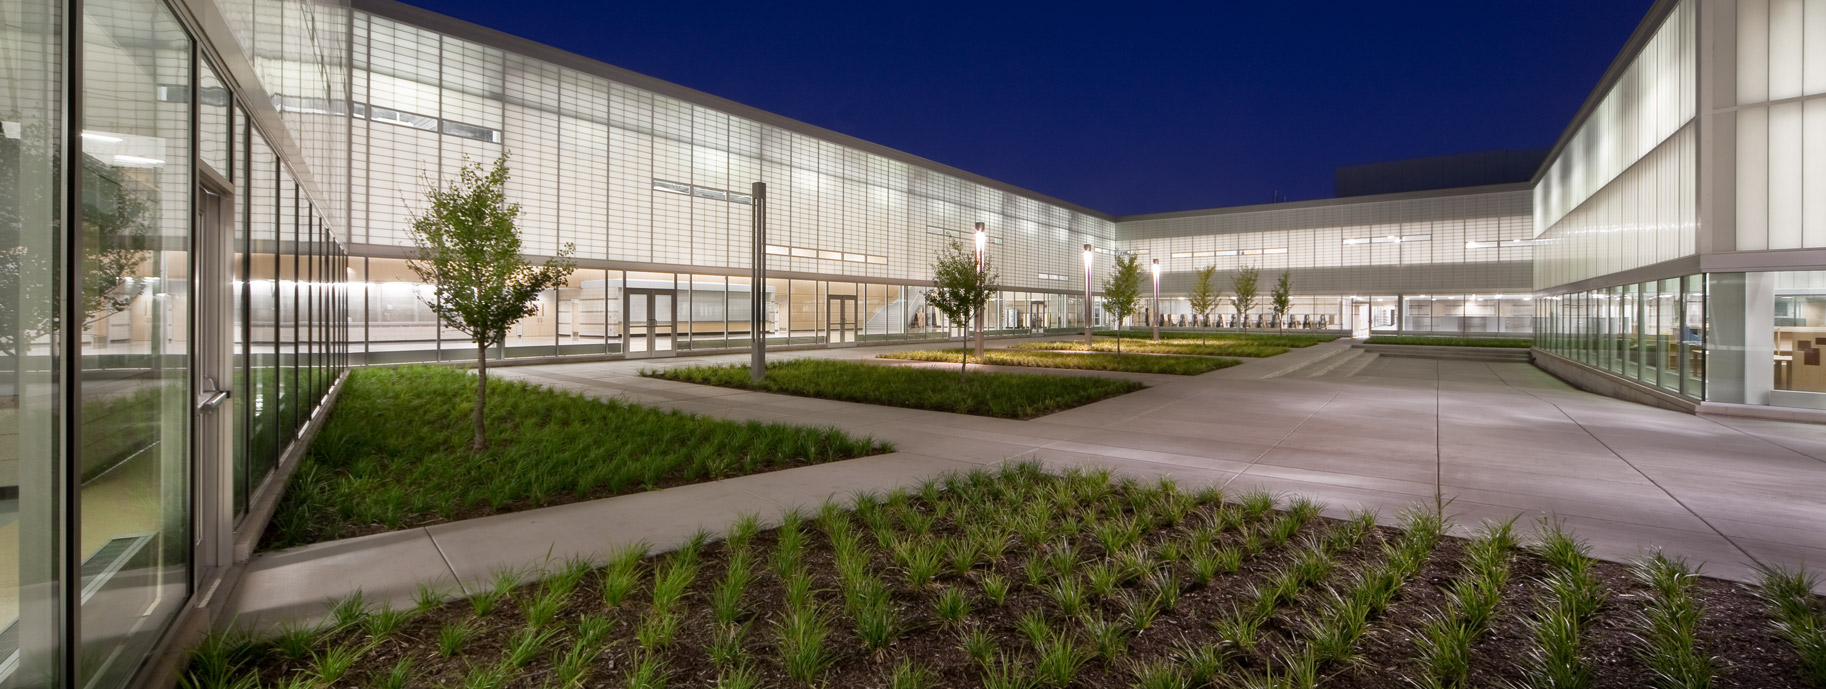
The project uses Kalwall unit skylights as well as a vision glass wall. The power of Daylight Modeling allows the design team to see where direct sunlight through glass is an issue that needs to be addressed.
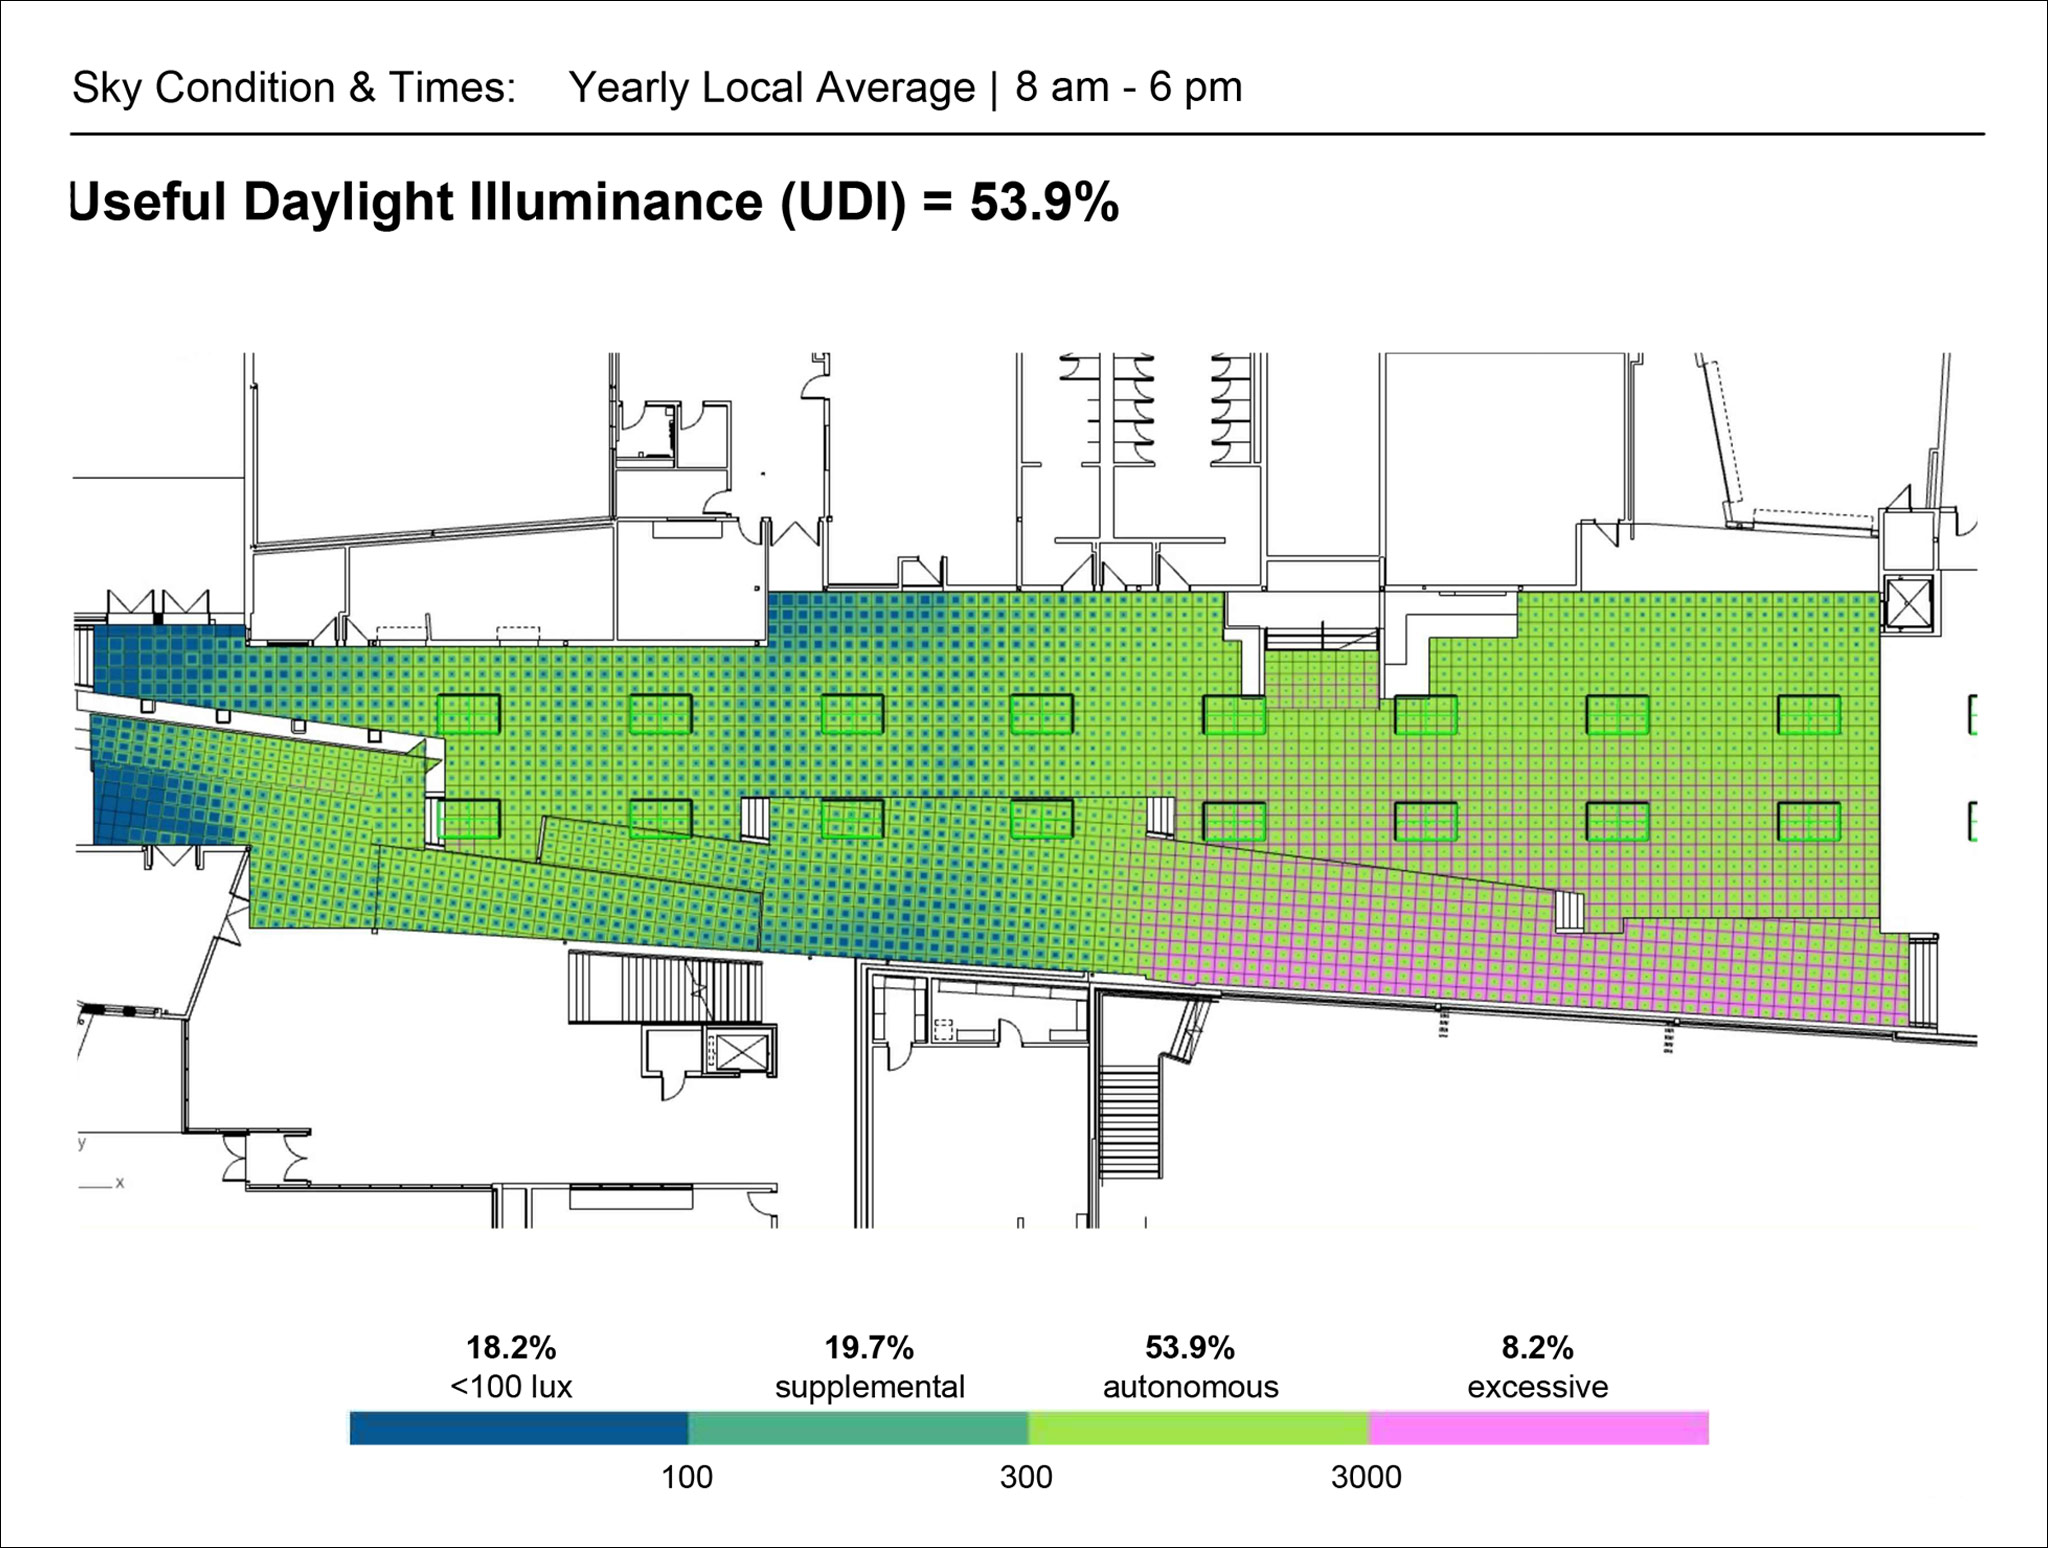
An annual illuminance metric that describes multiple categories of ‘usable’ lux levels in a space, reporting a percentage of floor area that falls within a specified illuminance range for 50% of the time.
Daylight illuminance levels <100 lux are generally insufficient for most tasks. 100–300 lux is considered sufficient, but may require artificial lighting for some tasks. 300–3000 lux is considered a desirable lighting level in most cases. Illuminance levels of >3000 lux are generally not usable, as this is likely to produce visual and thermal discomfort.
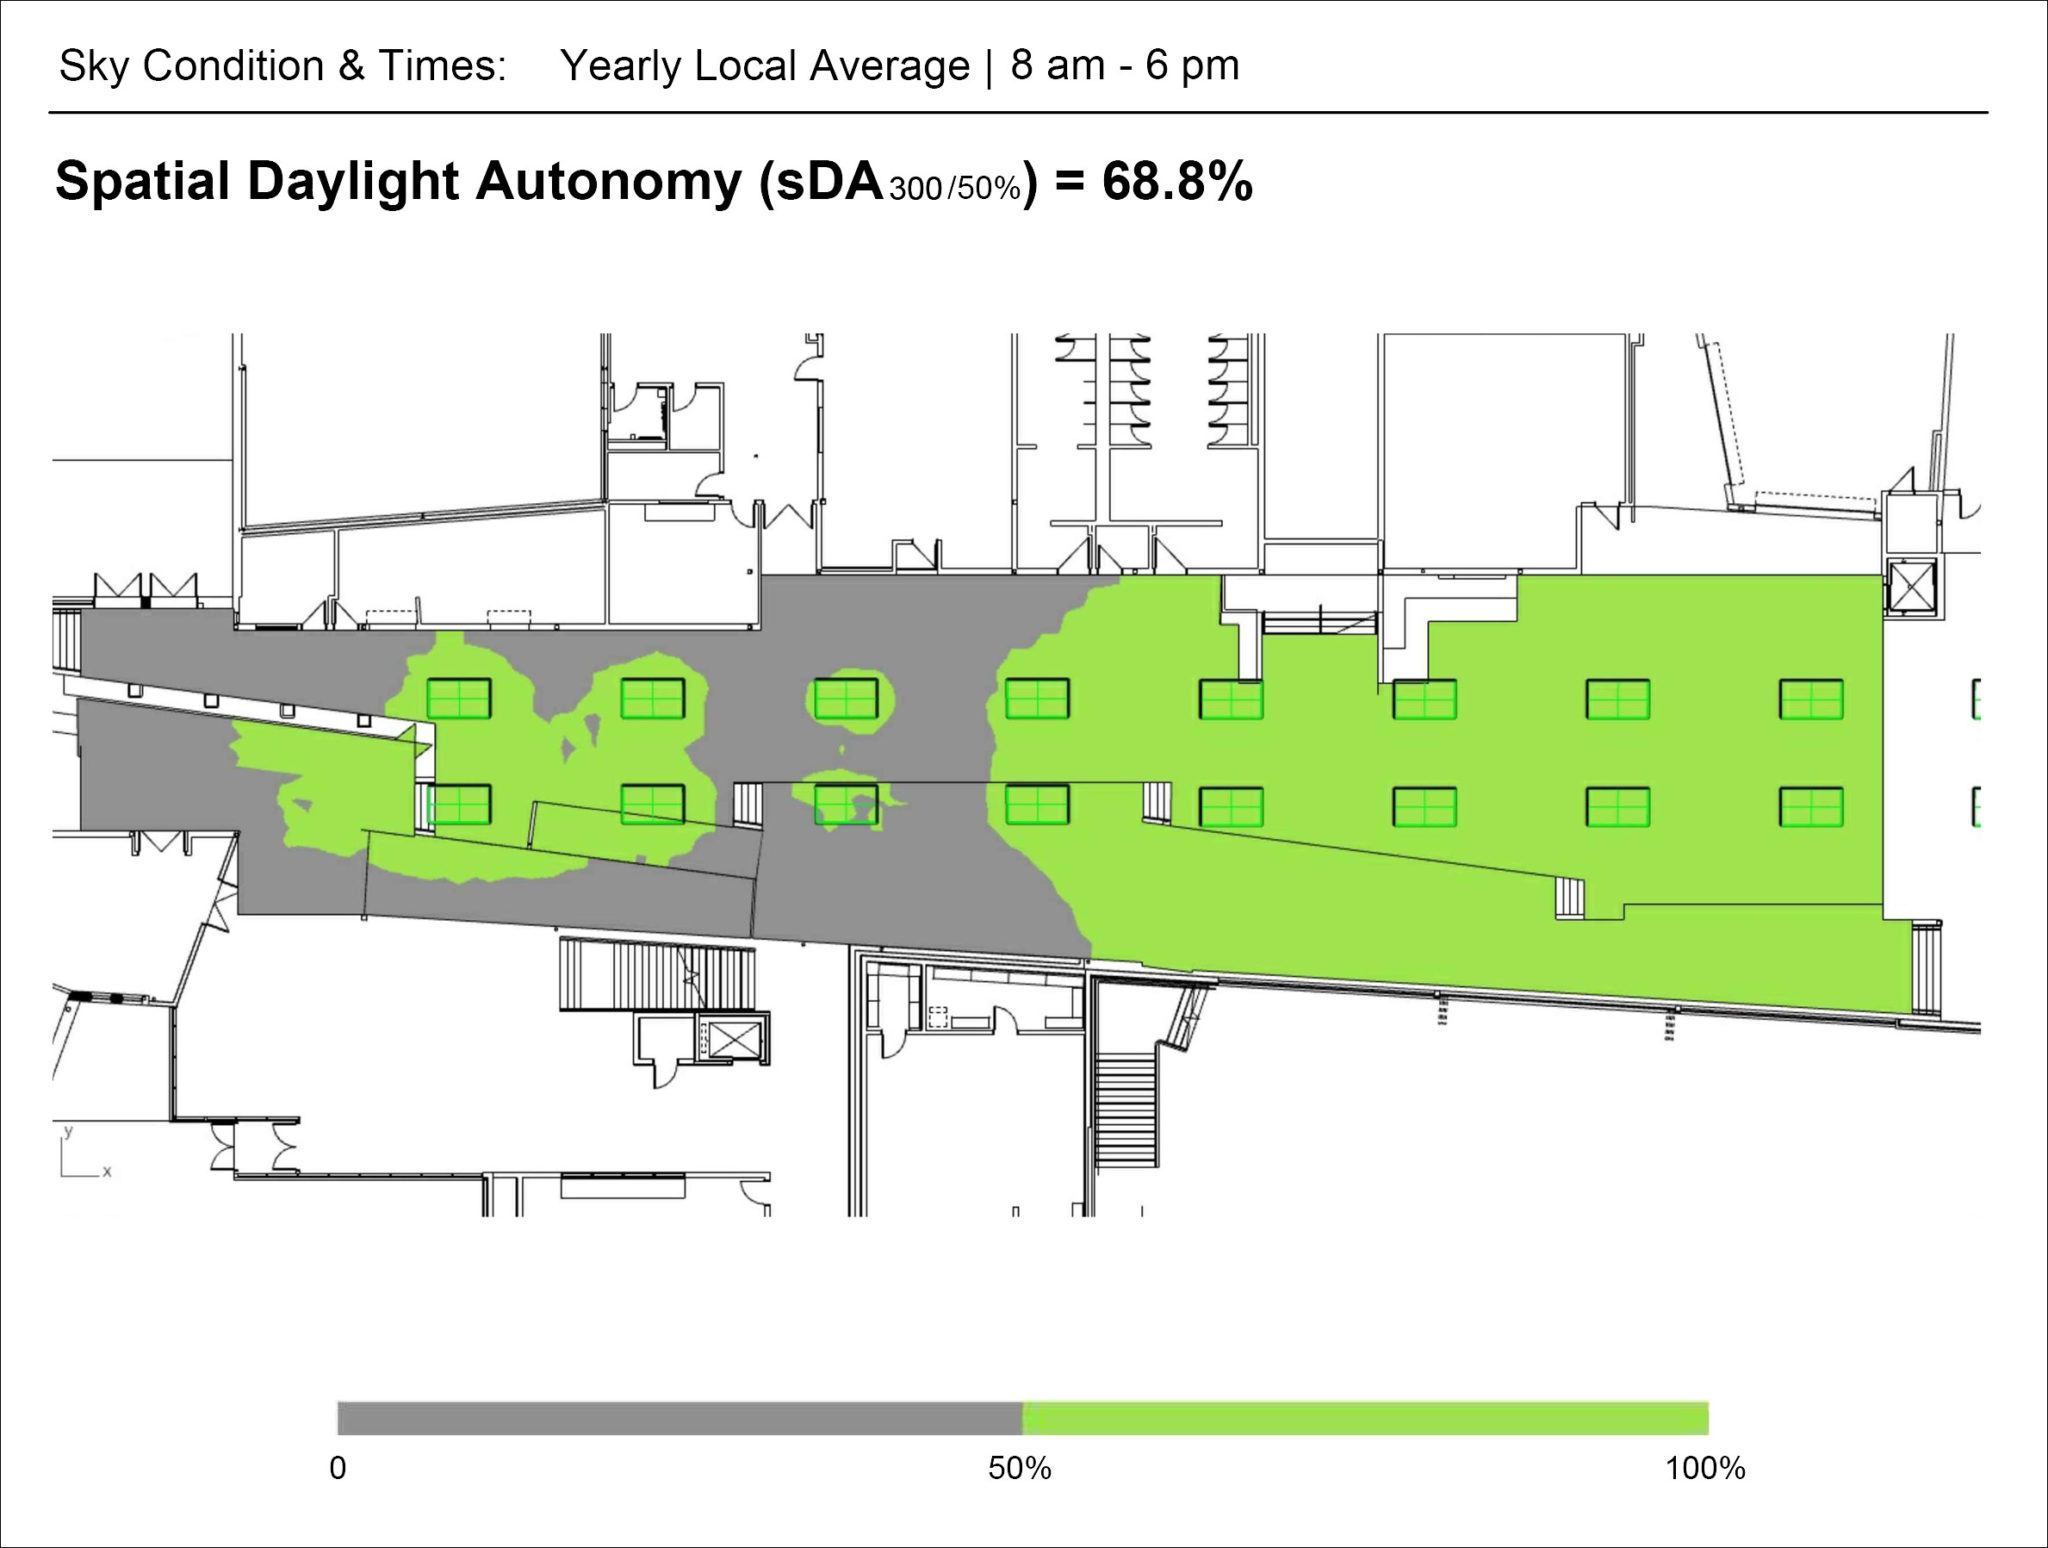
A measure of annual daylight sufficient for a given area, reporting a percentage of floor area that exceeds a specified illuminance level (e.g., 300 lux) for a defined analysis period (10 hours/day, 365 days/year).
For LEED® projects, scoring varies by building type; higher scores equals more credits.
sDA300/50% (300 lux for 50% of annual hours)
40% = 1 credit
55% = 2 credits
75% = 3 credits
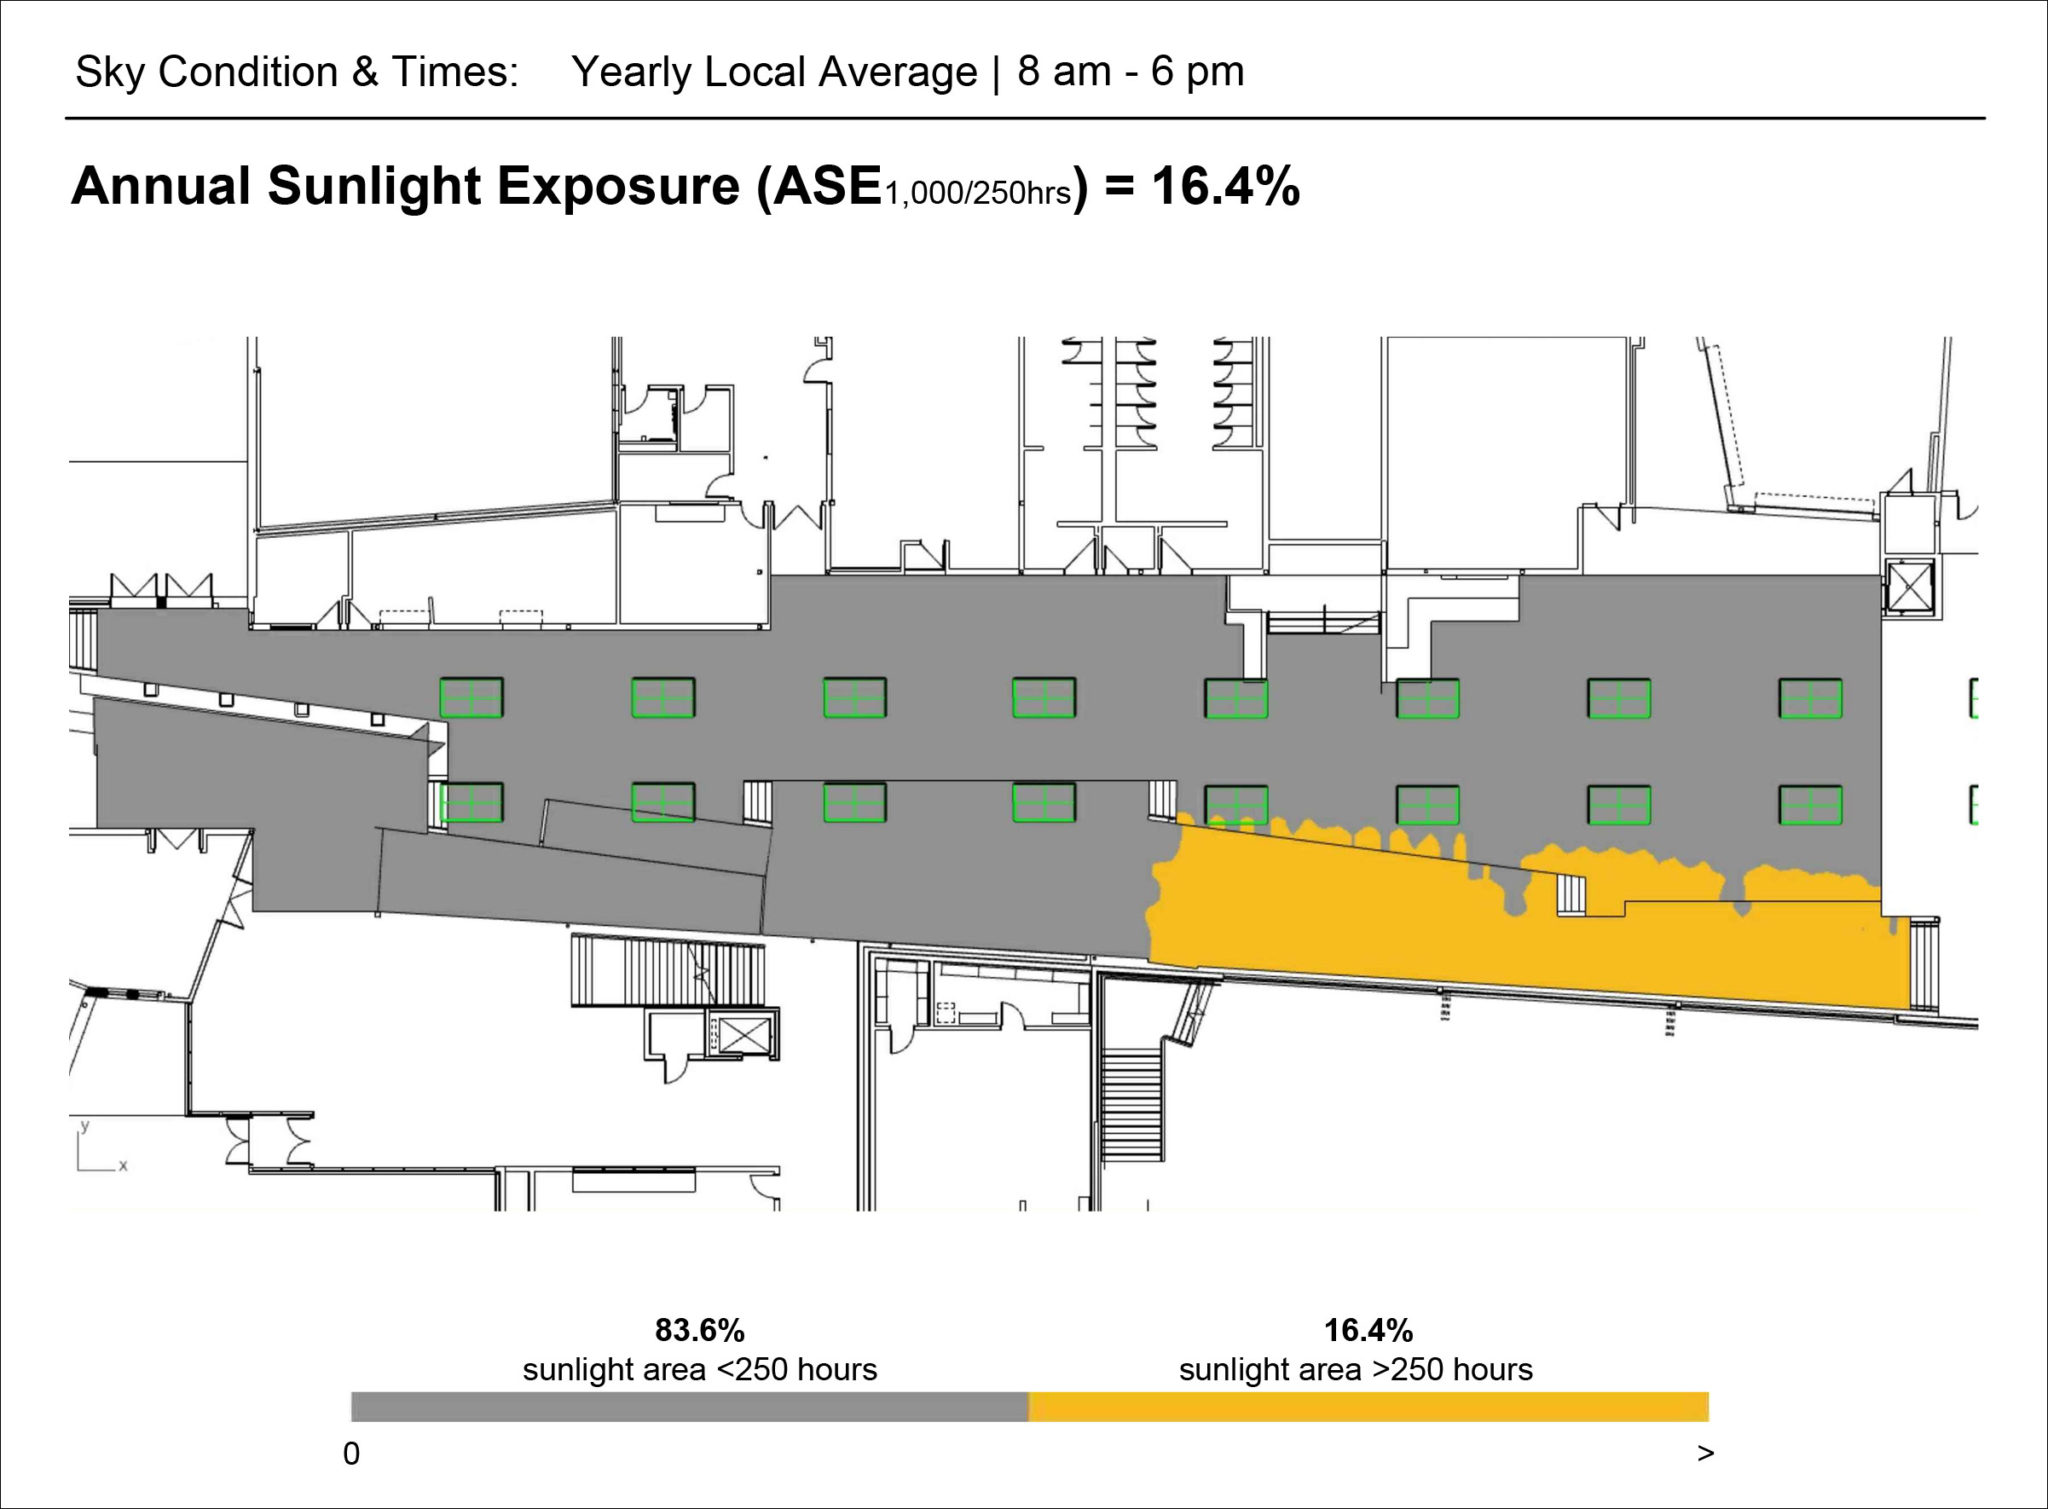
A measurement to help limit excessive sunlight in a space. Defined as the percent of a space in which direct sun exposure exceeds a pre-defined threshold (e.g., 1000 lux) for some quantity of hours (e.g., 250 hours) in a year. Although not technically a glare metric (see DGP below), ASE values can be used as a guide to identify potential sources of glare and solar heat gain. ASE is used in conjunction with sDA to determine LEED credits per the Illuminating Engineering Society’s Lighting Measurement 83 (LM-83), Approved Method: IES Spatial Daylight Autonomy (sDA) and Annual Sunlight Exposure (ASE).
ASE is not an issue when using translucent materials. However, transparent materials are problematic due to direct sunlight.
For LEED projects, ASE1000, 250h (1000 lux for 250 hours) for 10% of the space.
If ASE is > 10%, glare conditions must be addressed, or FAIL score for all LEED daylighting credits.
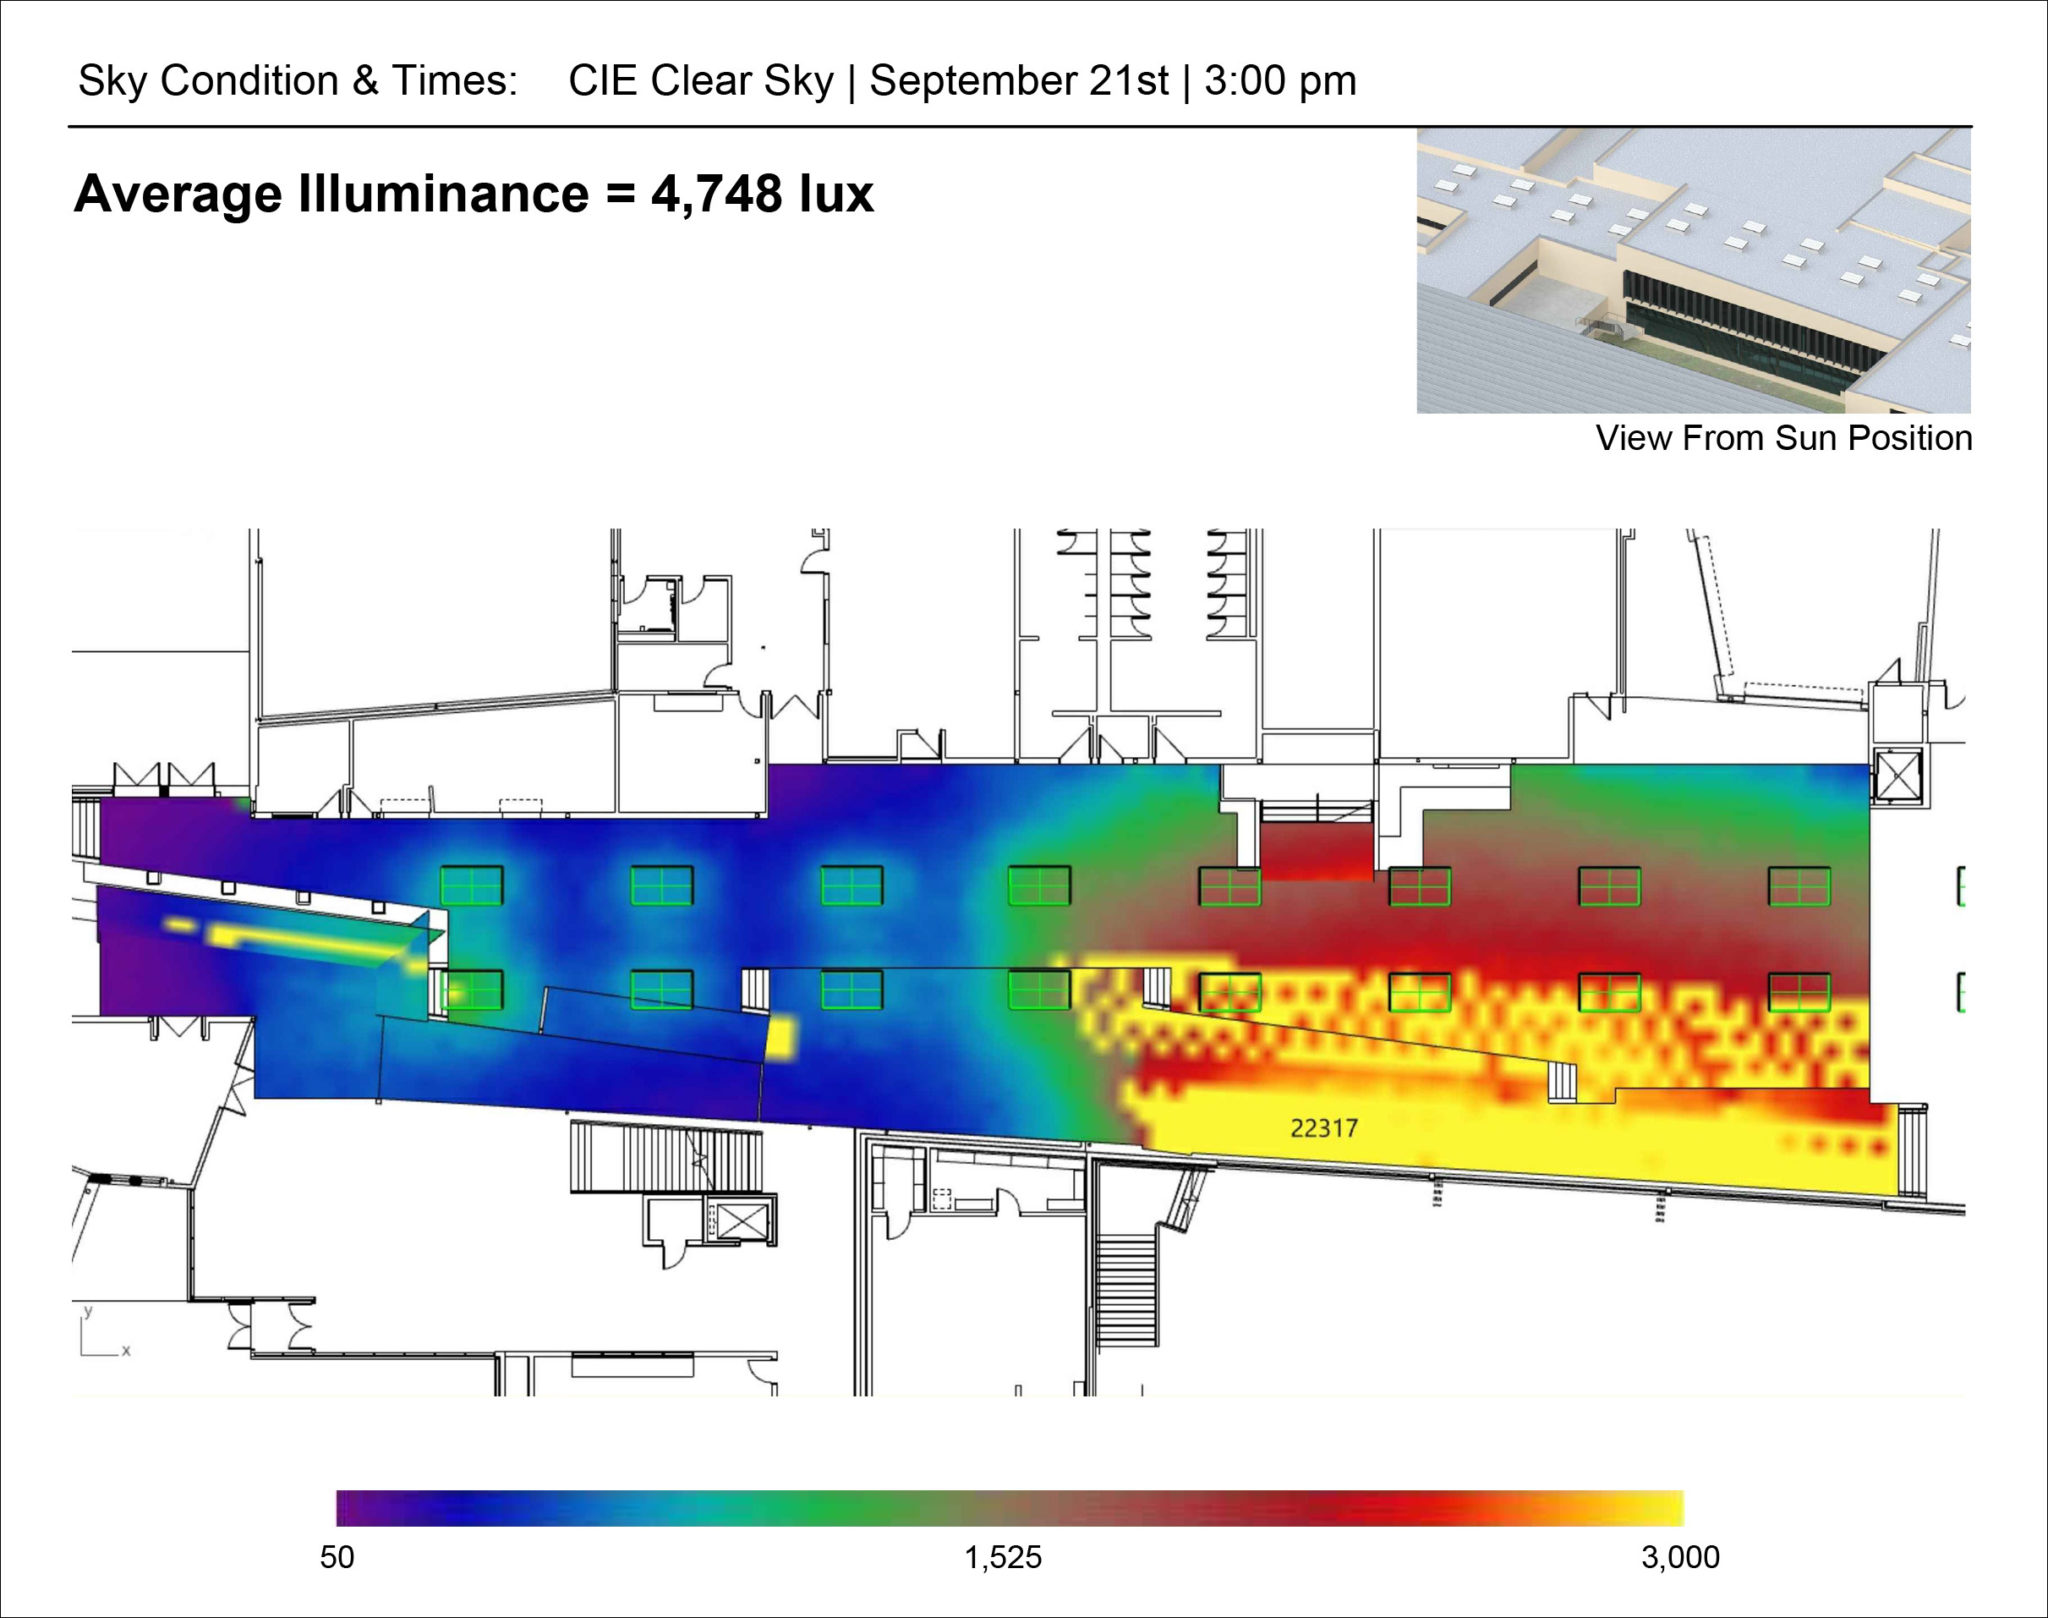
Point-In-Time Radiance Simulation – A metric that looks at specific light levels at a set day and time using localized sky conditions to review lighting design and glare.
Illuminance – The quantity of light emitted by a source that falls on a surface. Illuminance is measured in lux (lumens per m2) or footcandles (lumens per ft2). Results shown in Lux (1 fc = 10.76 lux).
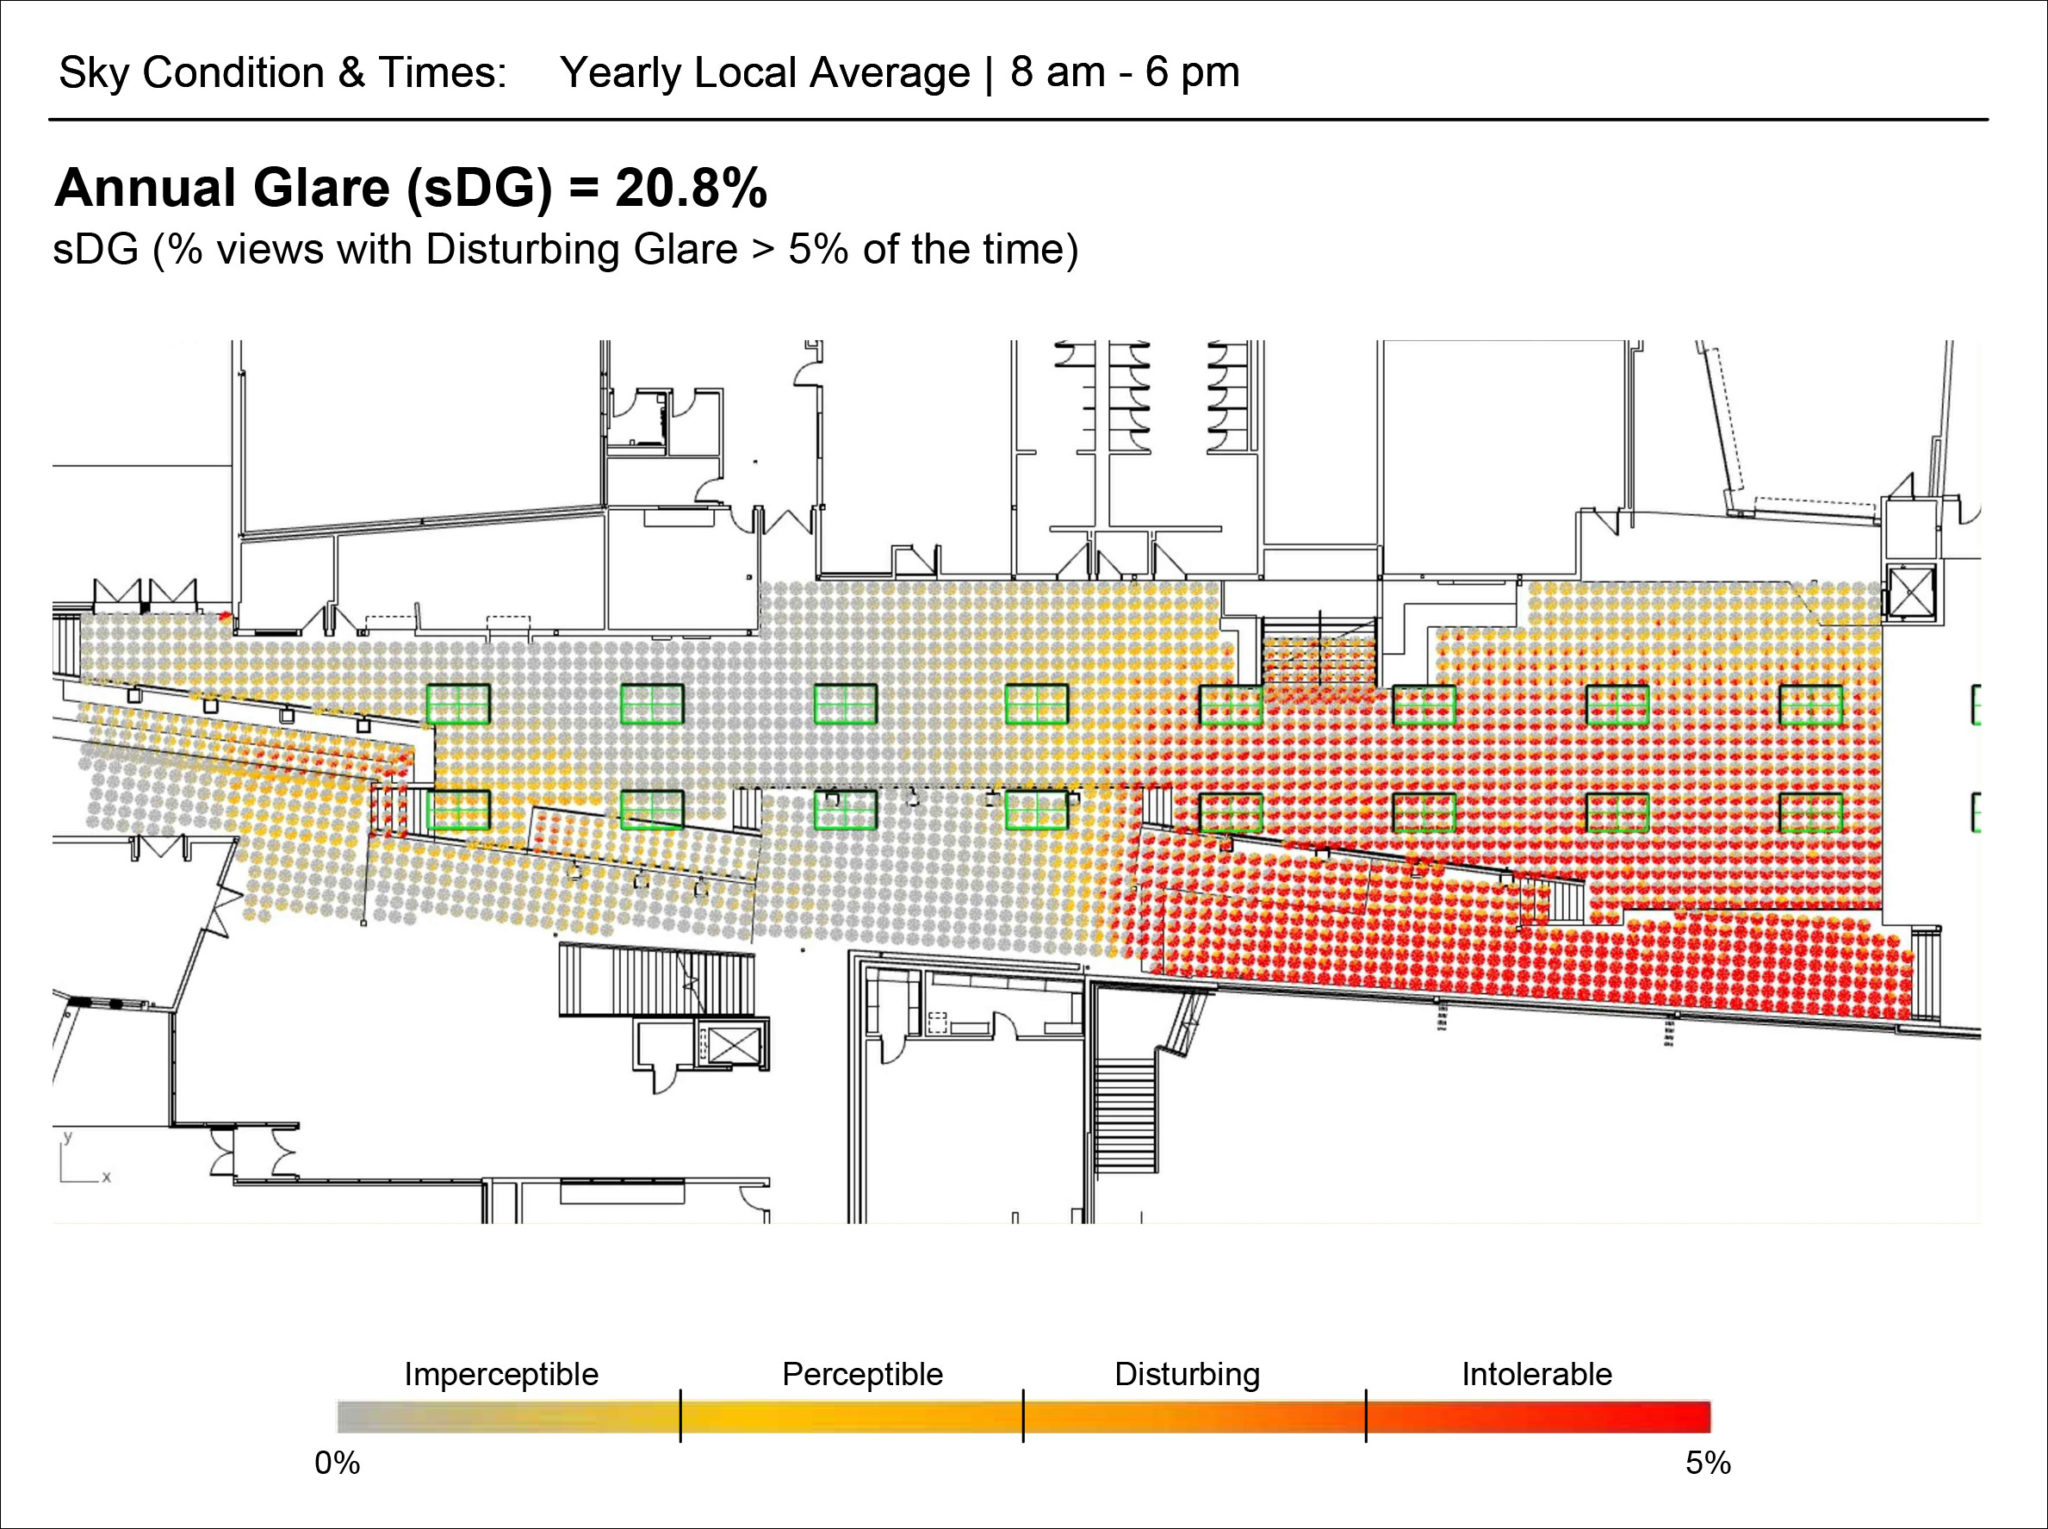
Helps to identify potential problem areas where glare is a concern and where visual acuity is critical; used for analysis in work/study areas.
Perceptible (DGPs>0.34)
Disturbing (DGPs>0.38)
Intolerable (DGPs>0.40)
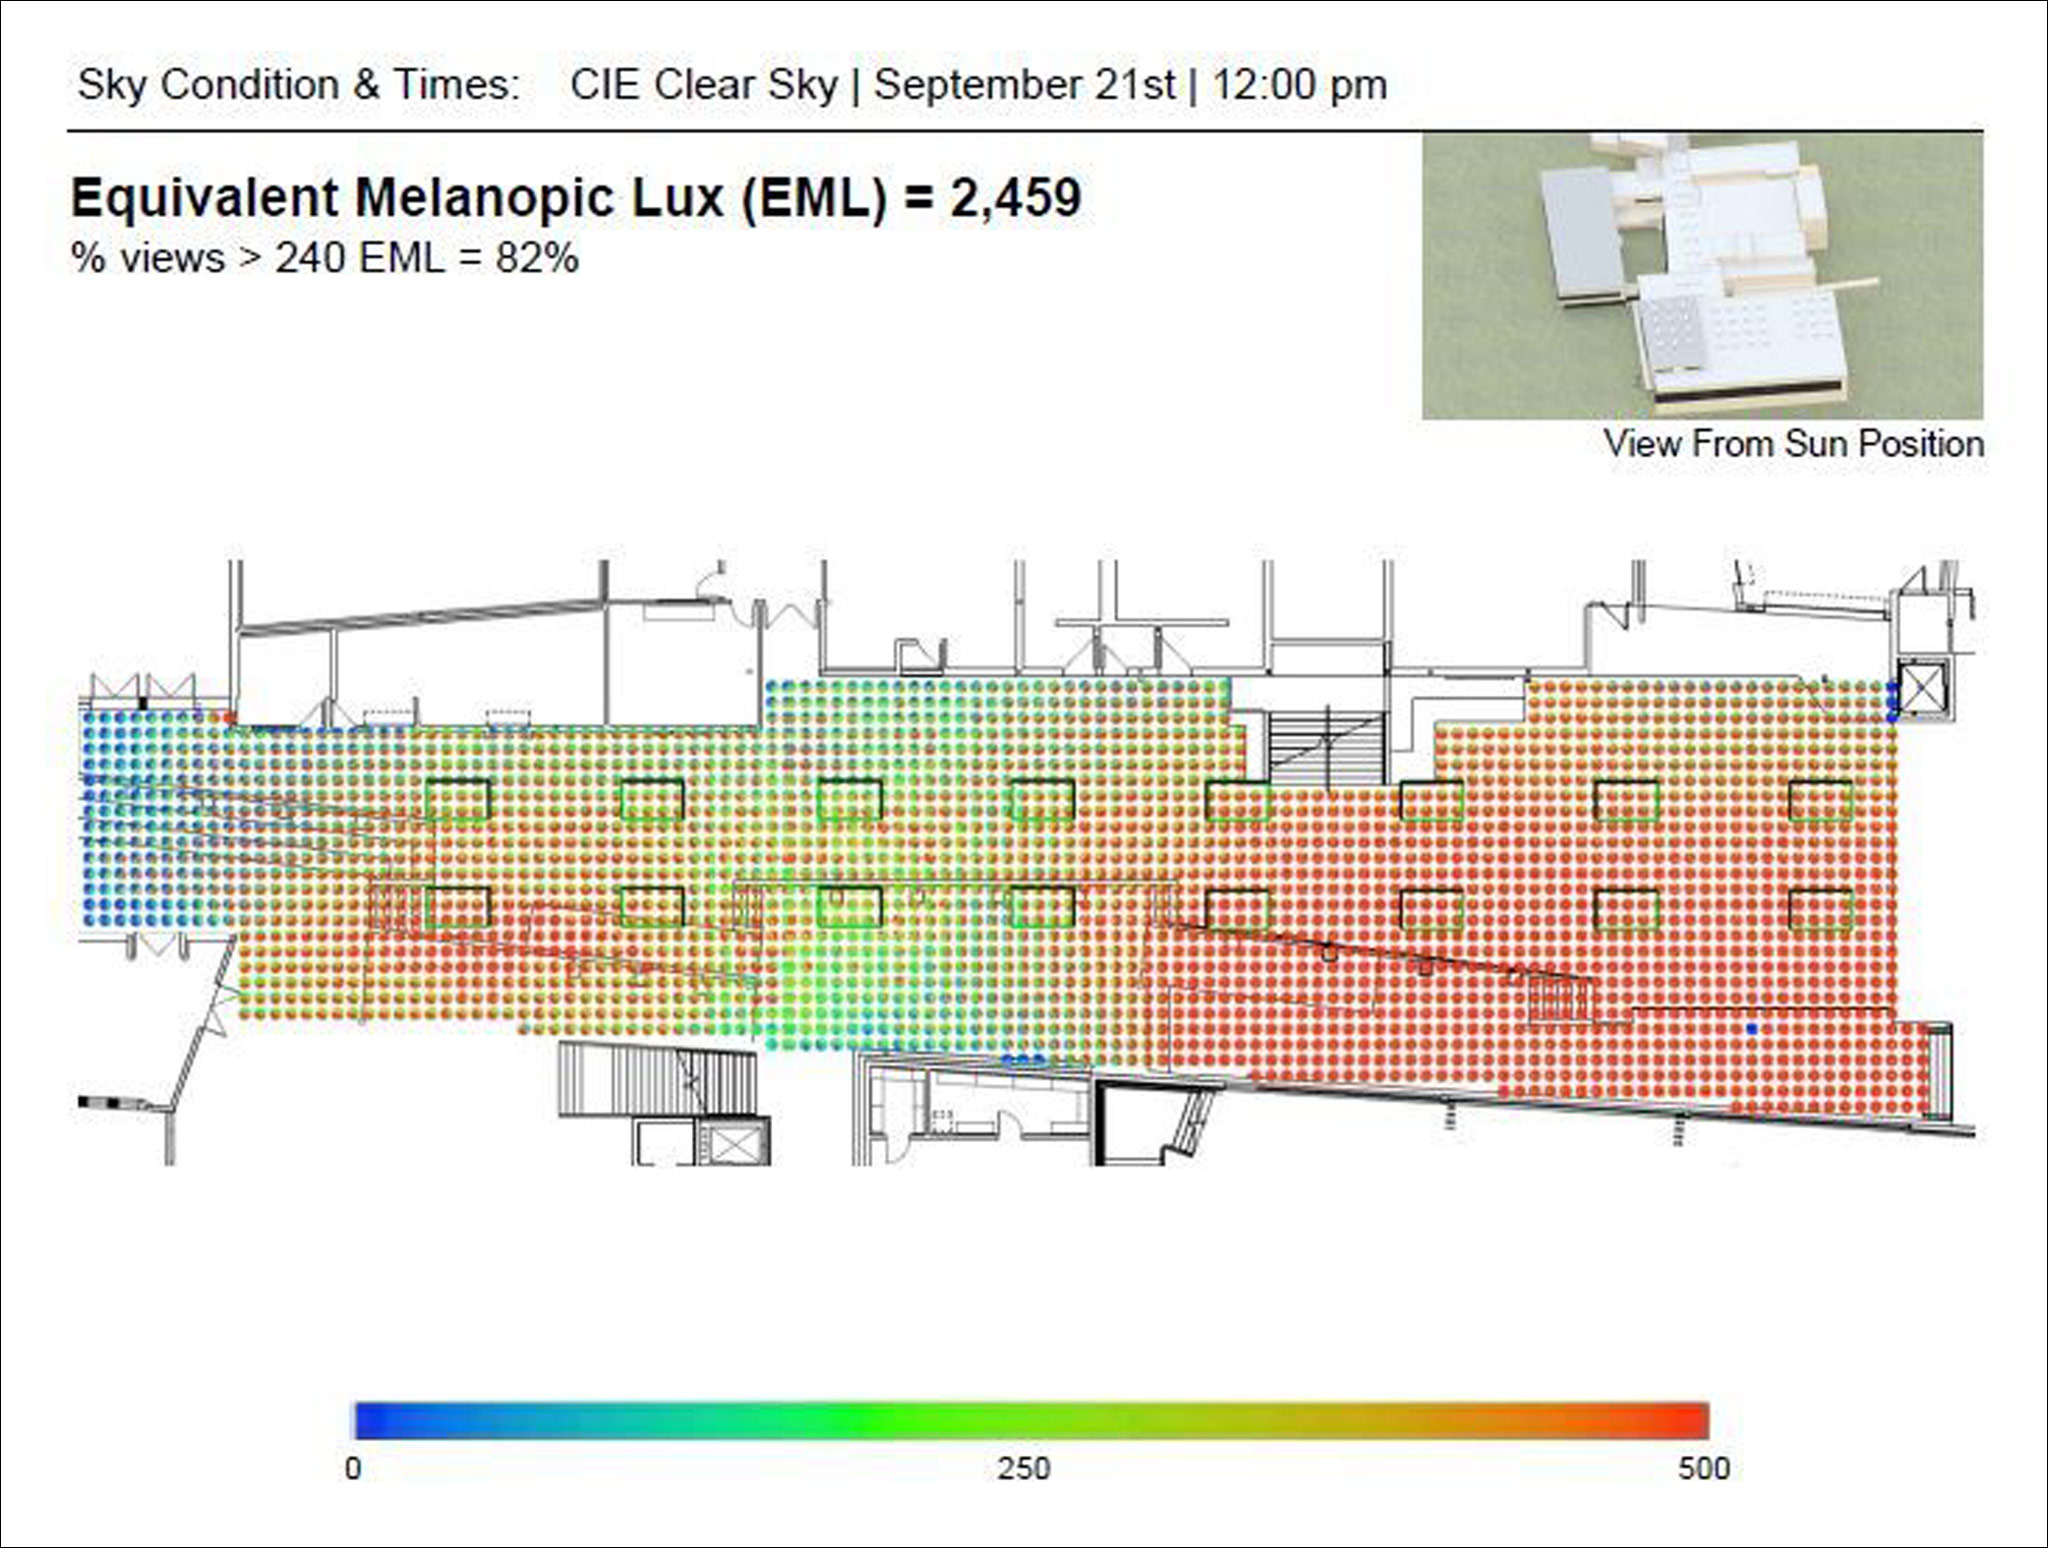
The metric for measuring biological effects of light on humans, used in the WELL v2 Standard.
150 EML or 120 EML + Lighting = 1 point
240 EML or 180 EML + Lighting = 3 points
When modeling for your project, the Kalwall team can work with you on product selection and optimization to achieve your daylighting objectives. Revisions of a Daylight Modeling report can be produced to explore design options.